<< Back to posts in Japan
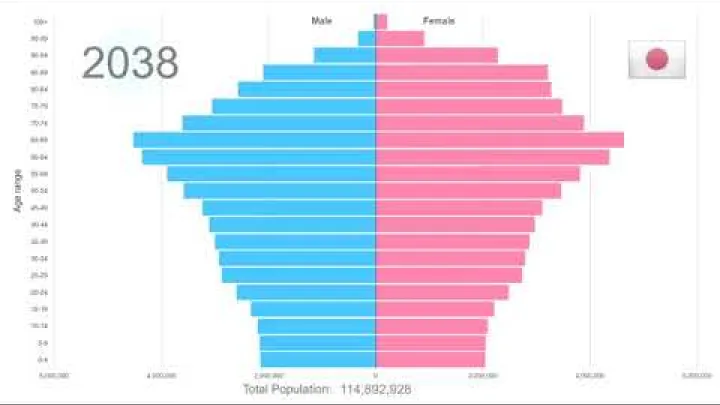
Japan Population Pyramid 1950-2100
An animated population pyramid shows how Japan's age structure changes from 1950 through 2100, highlighting narrower younger cohorts and the growth of older age groups.
Regional Topics
- Ishigaki Travel Guide: Plan Your Island and Yaeyama Trip
- Fukuoka Budget: Daily Travel Costs, Prices, and Ways to Save
- Nagasaki Best Time to Visit: Weather by Season and Month
- Kochi Travel Guide: Shikoku, Japan
- Takamatsu Budget: Daily Travel Costs, Prices, and Saving Tips
- Hiroshima Getting There: Shinkansen, Flights, Buses & Ferries
- Okayama Budget: Daily Travel Costs and Money-Saving Tips
- Nara Where to Stay: Best Areas and Accommodation Guide
- Kobe Where to Stay: Best Areas, Hotels & Transport
- Where to Stay in Osaka: Best Areas for First-Time Visitors
- Kobe Getting There: Trains, Flights, Buses and Ferries
- Takayama Travel Guide: Plan Your First Visit
- Kanazawa Travel Guide: A Practical First-Time Visitor Plan
- Kanazawa Best Time to Visit: Weather by Month
- Nikko Getting There: Trains, Buses, Airports & Road Routes
- Tokyo Travel Guide: Plan Your First Trip to Japan's Capital
Select area
Create a post
Posting is free and no registration is required.
Buy & Sell
Community
Housing
Jobs
Services
Travel Services
Living & Business Services