Japan Population: 2025 Estimate, Trends & Key Facts
![Preview image for the video "[Population Estimates] February 2026".](/sites/default/files/styles/media_720x405/public/oembed_thumbnails/2026-08/xdAWfKQOU-7D8zQCIMlpQIG4109C4NG_b6UQTzrYejw.jpg.webp?itok=F4eEQfJV "Preview image for the video \"[Population Estimates] February 2026\".")
Japan population is best understood as a dated statistical measure, not a live counter. The latest listed World Bank estimate is 123,366,734 people for the 2025 reference year, or about 123.4 million, and it is an estimate rather than a same-day enumeration. Japan's population grew for decades, reached a peak around 2010, and has since moved into a sustained decline. This guide explains how to read Japan population by year, why low fertility and an aging structure matter, and how urbanization, density, cities, and the population pyramid complete the picture.
How Many People Live in Japan?
The short answer depends on the type of population figure being used. A national estimate for one year is not the same as a census count taken on a reference date, and neither should be confused with a projection about the future.
The Latest Reliable Japan Population Figure
The latest listed international estimate in the supplied World Bank series is 123,366,734 people in 2025. Rounded for everyday use, that is approximately 123.4 million people. The geographic definition is Japan as a country, and the reference year is 2025.
This figure answers the question how many people live in Japan most directly, but it should be described as a 2025 population estimate. It is not a live count of everyone currently inside the country, and it is not a direct 2025 census enumeration. A reader using the number in a report, class assignment, or relocation comparison should retain both the year and the word estimate.
The rounded figure is useful for understanding scale, while the exact value is useful when comparing datasets. The two forms refer to the same 2025 national estimate. They should not be combined with a different year's national estimate to create a number that appears current.
Census Counts, Annual Estimates, and Projections
A census count is a direct enumeration or census-based count of people according to the rules of a particular census. Japan's 2020 Population Census is the latest census benchmark identified in the supplied evidence. The Statistics Bureau of Japan publishes its summary results and statistical tables. This benchmark is especially valuable because it provides a detailed, official snapshot against which later estimates can be understood.
An annual estimate starts with a census or another demographic benchmark and updates it for changes such as births, deaths, and migration. It is designed to describe the population at a later reference date even when a new full census has not taken place. The 2025 figure above belongs to this estimate category, so calling it a census count would give readers the wrong impression about how it was produced.
A projection is different again. It is a modeled description of what the population could look like in future years under stated assumptions about fertility, mortality, and migration. A projection is not a measurement of the present. It can change when the assumptions change, so it should not be used as evidence that Japan already has a future population total.
The practical rule is simple: place the label census count, estimate, or projection beside every population figure. Also record the reference date, the population definition, the geographic area, and the source. These details make comparisons meaningful and prevent a direct census count from being mistaken for a modeled estimate.
Why Published Population Figures Can Differ
Credible population figures can differ without one source necessarily being wrong. The first reason is timing. A national estimate may refer to the start or middle of a year, while a census uses a specified census date. Even two figures labeled with the same year may represent different dates within that year.
The second reason is definition. A statistical system may count usual residents, people present on a particular date, or residents included under a specific registration rule. International datasets may also harmonize national data so that countries can be compared consistently. That process can produce a figure that is useful for international comparison but not identical to the latest national estimate.
Geographic boundaries also matter. Japan's national total is not interchangeable with the population of a prefecture, a municipality, a city proper, or a metropolitan area. The safest approach is to choose one primary series for the main Japan population by year narrative, then present a census result, national estimate, or projection as a separately labeled comparison. Avoid live population counters and composite figures made by blending values from different years.
Japan Population by Year: From Growth to Decline
Japan's long-term population story has two broad phases: substantial postwar growth followed by a peak and a persistent decrease. The exact value for any year depends on the series and reference date, but the direction of change is clear.
Postwar Growth and the Population Peak
Japan experienced strong population expansion during the postwar decades. The national total increased as large cohorts moved through childhood and adulthood, and population growth continued even after fertility began to fall. The main historical series place Japan's population peak around 2010.
This delay is an example of demographic momentum. A population does not respond immediately to a change in fertility because its existing age structure continues to shape births, deaths, and the number of people entering family-forming ages. Large earlier cohorts can keep the total growing for a period, even when the average number of children per woman is already lower than in previous generations.
For that reason, a fertility decline and a population peak do not have to occur in the same year. Understanding the timing helps explain why Japan could experience decades of growth before the national total turned downward.
The Population Decline Since 2010
Since the peak period around 2010, Japan's population has followed a gradual and persistent downward direction rather than a single sudden collapse. The year-to-year movement can vary, but the broad trend is a smaller national total over time. The 2025 World Bank estimate is therefore best read as part of a long decline, not as an isolated change.
The decline reflects the interaction of fewer births, an older age structure, deaths exceeding births in many periods, and migration that may offset only part of the decrease. These factors do not all have the same timing. Birth trends influence the size of future cohorts, while the current age structure influences deaths and the number of people in working and family-forming ages today.
For a reader comparing countries, the important point is direction and duration. Japan's population growth phase has ended, and the country is managing a demographic contraction that affects both large metropolitan areas and smaller communities, although the local effects are not uniform.
How to Read a Japan Population by Year Table
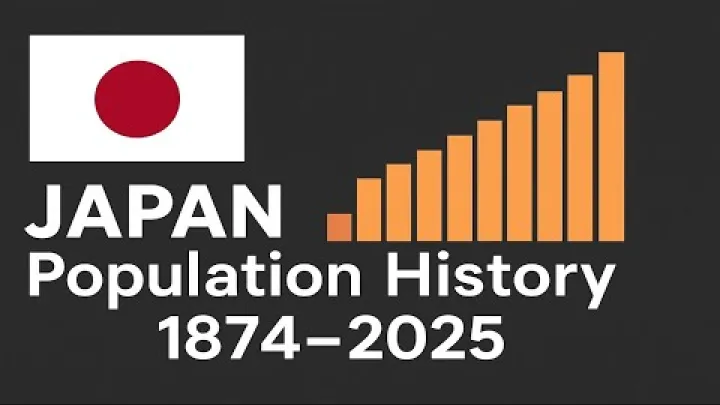
A Japan population by year table should use one dataset, one national geographic definition, one unit, and consistent reference dates. The compact view below uses the World Bank population-total series for the trend description. The supplied evidence verifies the exact 2025 value, while the historical milestones are shown directionally rather than filled with unverified numbers.
| Reference year | Population-series reading | Classification |
|---|---|---|
| 2010 | Around Japan's historical population peak | Historical estimate |
| 2020 | Below the peak-period level | Historical estimate, not the census count |
| 2025 | 123,366,734, or about 123.4 million | Latest listed estimate |
The 2010 and 2020 rows show the direction of the same series, not exact values. The 2020 historical estimate should not be confused with Japan's 2020 census count. For a complete year-by-year sequence, use the World Bank population series and keep the same indicator throughout. Do not fill missing years through interpolation, and do not place projected values among historical observations without a clear projection label.
Why Japan's Population Is Declining
Japan's population decline has no single cause. Low fertility reduces the number of younger people, aging increases the demographic weight of older cohorts, and natural decrease can outweigh migration gains. Each factor should be read as part of the same population-accounting system.
Low Fertility and Fewer Births
Below-replacement fertility means that, over the long term and without offsetting migration, the average number of children born to women is not sufficient to replace the population from one generation to the next. In Japan, this has reduced the size of younger cohorts and created a long-term base for population decline.
Fertility rate and annual number of births are related but different measures. A fertility rate describes the average childbearing level under a defined statistical method. The annual number of births is the total number of births recorded during a reference period. A country can have a low fertility rate and still experience year-to-year changes in births because the number of women in childbearing ages also changes.
Low fertility is therefore a structural factor, not a complete explanation for every annual movement. A short-term change in births would not immediately reverse the total population trend because children born today enter the population first as a young cohort and affect the working-age structure only much later.
Aging, Longevity, and Natural Decrease
Natural decrease occurs when deaths exceed births during a reference period. Total population change can be understood broadly as births minus deaths plus net migration. When deaths are higher than births, population decline can continue even if migration is positive.
Japan's older age structure increases the importance of this balance. A large older population can produce more deaths in absolute terms, while low fertility produces fewer young people moving into adulthood. People living longer is not, by itself, a cause of population decline. Longevity becomes part of the decline mechanism when it interacts with low fertility and an age structure that contains many older residents.
This also explains why population decline can continue after earlier fertility reductions have already occurred. The age structure carries the effects of past demographic behavior forward. The country is not simply losing people at random; it is moving through a population profile with relatively smaller younger cohorts and larger older cohorts.
Migration as a Partial Offset
Migration can slow population decline, but it does not automatically restore population growth. If deaths exceed births by more than the number added through net migration, the national total still falls.
The World Bank's listed 2025 net-migration observation is 140,579 people. This is a net flow for its reference period, as shown in the World Bank net migration series. It is not the number of foreign residents living in Japan, the number of arrivals, or a count of people who will remain permanently.
These distinctions matter. A net migration flow subtracts departures from arrivals over a period. A foreign-resident stock measures how many foreign residents are present under a particular definition at a point in time. Temporary workers, students, returning nationals, and longer-term residents may be treated differently across datasets. Migration can provide labor and population support, but its scale and demographic effect should be discussed using the specific flow or stock being measured.
Urbanization, Population Density, and Regional Distribution
Japan's national total does not show where people live. The country combines dense metropolitan corridors with sparsely settled mountainous and peripheral areas, and population decline can affect these places in different ways.
Urbanization and Metropolitan Concentration
The World Bank urban population indicator lists Japan's urban population share at 92 percent in 2025. This means that 92 percent is a share of the national population classified as urban for that reference year; it is not a count of people living inside Tokyo or any other single metropolitan area. The classification also depends on the statistical definition used for urban areas.
Japan's population is strongly concentrated around major metropolitan centers. The Tokyo metropolitan area is the largest concentration in the national system, while the Osaka-Kobe-Kyoto metropolitan region and Nagoya are other major centers of employment, services, transport, and institutions. These regional labels cover areas that extend beyond individual city boundaries, so they should not be used as city-proper population figures.
Urbanization and total population can move in different directions. The urban share can remain high or rise while Japan's national population decreases if smaller communities lose residents faster than metropolitan areas do, or if people continue to concentrate in already urban locations. A high urban share therefore describes settlement pattern, not population growth.
Population Density and Japan's Uneven Settlement Pattern
Population density measures people per unit of land. The World Bank density series for Japan is measured in people per square kilometer of land area and lists data through 2023, its latest available year in the supplied evidence. The World Bank population-density series uses a national average that is useful for broad comparison but cannot describe every region.
A national density average conceals strong contrasts. Dense coastal plains and metropolitan areas contain many more people and buildings in a limited area, while mountainous districts and peripheral regions are more sparsely settled. The same national average can therefore coexist with crowded urban neighborhoods, agricultural land, forests, and communities experiencing population loss.
Density is also different from urbanization. Density asks how many people occupy a unit of land. Urbanization asks what share of the population lives in areas classified as urban. A place can have high density without being part of a large metropolitan area, and an urban region can contain both very dense centers and lower-density outer areas. Do not use Japan's national average to characterize Tokyo, a rural prefecture, or an individual municipality.
How to Compare Tokyo and Other Japanese Cities
City-population searches often produce conflicting rankings because the word city can describe several different geographic units. Before comparing Tokyo with Osaka, Kyoto, Sapporo, or Fukuoka, identify the boundary and year for every figure.
- City proper or municipality: the population inside an officially defined local government area.
- Prefecture: a larger administrative area that can contain cities, towns, rural districts, and suburbs.
- Metropolitan area: a connected urban and commuting region that usually crosses multiple municipalities and may cross prefectural boundaries.
Tokyo needs particular care because Tokyo Metropolis, its special wards, and the wider Tokyo metropolitan area are different units. Osaka and Kyoto can refer either to their city municipalities or to prefectures with the same or similar names. Sapporo and Fukuoka are commonly discussed as city municipalities, but metropolitan comparisons can include surrounding municipalities as well. The Osaka-Kobe-Kyoto region is a metropolitan system, not a single city total.
For a defensible comparison, choose one current official table, use the same reference year, and select the same geographic level for every row. A municipality-to-municipality comparison is different from a metropolitan-area ranking. The 2020 census provides a consistent historical benchmark for many local comparisons, while later estimates may use different reference dates. The Japanese government statistical tables can help readers identify the place-of-usual-residence definition and administrative unit. If a current city-level value cannot be verified on the same basis for every city, a qualitative comparison is more accurate than a fabricated ranking.
Japan's Population Pyramid and Age Structure
A population pyramid explains how Japan's total population is distributed by age and sex. It adds information that a single national total cannot show, especially the difference between the size of younger, working-age, and older cohorts.
How to Read Japan's Population Pyramid
A population pyramid is a chart with age groups arranged vertically and the two sexes shown on opposite sides. The length of each bar represents the population in that age group, or its share if the chart is presented in percentage form. A broad base indicates relatively large younger cohorts, while a narrower base indicates fewer children compared with older age groups.
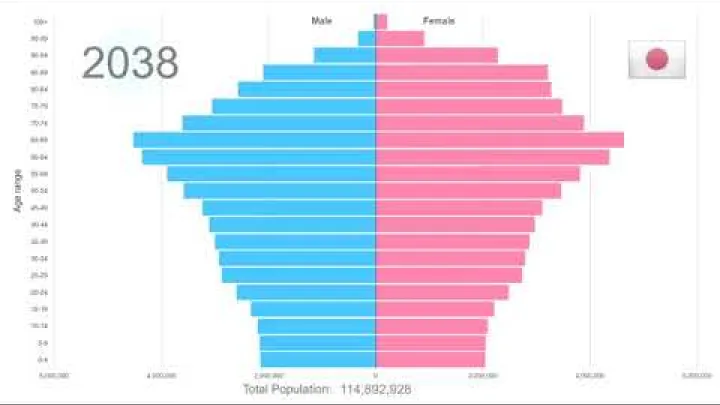
Japan's broad pattern is an older population structure with narrower younger cohorts and larger older cohorts. This shape is not a direct measure of total population size. Two countries can have the same total population but very different pyramids, and one country can have a similar total in two years while its age distribution changes substantially.
Always check the date and type of chart. An observed pyramid may be based on a census or estimate. A future pyramid is a projection built from assumptions. A projected older population should not be described as an observed current distribution, and a chart from one reference year should not be presented as though it describes every later year.
Older Residents and the Working-Age Population
The phrase 65 and above refers to residents who have reached the lower age threshold of 65, expressed as a share of the total population when used as a percentage. The working-age population is a separate statistical category for people in the ages commonly considered relevant to labor-force participation. The exact boundaries can vary by dataset, so the definition should be read before comparing figures.
A review article available through PMC reported that people aged 65 and above represented 27.7 percent of Japan's total population in 2017. That is a dated population share, not an absolute count and not a current 2025 figure.
The World Bank age-share series covers Japan through 2025 and allows readers to examine the later 65-and-above share using its own definition and reference year. A 2017 academic estimate and a 2025 World Bank observation should not be blended as though they were contemporaneous. Before comparing them, check the year, denominator, source method, and whether the value is observed, estimated, or projected.
As the older share rises and the working-age base becomes smaller in relative terms, a declining total population has different consequences from a decline spread evenly across all ages. The country may have fewer people available for work and a larger share of residents needing age-related services, even when the national total changes gradually.
Why Age Structure Matters
Age structure affects the supply of workers, the number of people contributing to and drawing from pension systems, demand for health care, and the organization of local services. These are demographic pressures, not guaranteed outcomes. Technology, labor-force participation, productivity, migration, and public policy can change how strongly population aging affects society.
Regional effects can also differ. A large metropolitan area may continue to attract younger workers and maintain major services even as the country ages. Smaller or peripheral communities may face a sharper reduction in younger residents, making schools, transport, medical access, and local administration more difficult to sustain. The national age structure does not determine the exact experience of every prefecture or municipality.
The central demographic lesson is that age structure has inertia. Even if births or migration change in the short term, the existing distribution of people by age continues to influence the number of deaths, workers, parents, and children for many years. This is why Japan's age structure helps maintain downward pressure on the total population even when individual components vary from one reference period to another.
Conclusion: What Japan's Population Figures Show
Japan has an estimated population of 123,366,734 people in 2025, or about 123.4 million. That figure is a national estimate, while the 2020 Population Census is a separate census benchmark. Japan's population expanded during the postwar period, peaked around 2010, and has since declined as low fertility, natural decrease, and an aging age structure outweigh the partial support provided by migration.
The distribution is as important as the total. Urban residents account for 92 percent of the population in the 2025 World Bank urban-share indicator, while density varies sharply between metropolitan and rural areas. Tokyo, Osaka, Kyoto, Sapporo, and Fukuoka must be compared using the same administrative boundary and reference year. Reading the population pyramid alongside the national total gives the clearest view of why Japan's demographic change is gradual, persistent, and uneven across regions.
Select area
Create a post
Posting is free and no registration is required.