China Population: 2025 Estimate, Trends, and Outlook

China’s latest listed population estimate is about 1.41 billion people in 2025, according to World Bank Open Data. This is a modeled estimate, not a new census count. China’s official annual statistics show that the national population has moved from long-term growth into a period of natural decrease, while urbanization and population aging continue. The sections below explain the main China population figures, how they differ, and what the demographic direction means.
How Many People Live in China?
The answer depends on whether the figure is a census count, an official year-end statistic, an international estimate, or a future projection. A reliable population answer should always include the reference year and the definition used.
The Latest Reliable China Population Figure
The most direct current answer is that China had an estimated population of 1.41 billion in 2025. The figure is the most recent value listed in the World Bank data used here and is rounded to two decimal places in billions. Because it is a modeled estimate, it should not be described as a headcount taken on a particular day.
For an official national benchmark, the National Bureau of Statistics of China reported a population of 1,409.67 million at the end of 2023. The figure appears in the NBS 2023 Statistical Communiqué and refers to the year-end population under the statistical coverage used by the bureau. It is therefore separate from both the 2025 international estimate and the 2020 census count.
If a short answer is needed, use “about 1.41 billion people in 2025, based on an international estimate.” If the question requires an official observed benchmark, state the reference date and use “1,409.67 million at the end of 2023.” Keeping those descriptions together prevents a rounded estimate from being mistaken for a census result.
Why China Population Figures Differ
Population totals differ because they measure different things at different times. A census attempts a large-scale enumeration of people within a defined territory. An annual official statistic is usually produced from administrative and demographic information and is tied to a specific date. An international estimate applies a statistical model to available national and international data. A projection extends a model into future years using assumptions about births, deaths, and migration.
![Preview image for the video "China Population History & Projection by Pyramid - UN (1950~2100) [2019 rel]".](/sites/default/files/styles/media_720x405/public/oembed_thumbnails/2026-08/79s89t39K4rH_mffhXQ8nZjtubTBZb_hL1TyZVE-RgA.jpg.webp?itok=RZgkizV- "Preview image for the video \"China Population History & Projection by Pyramid - UN (1950~2100) [2019 rel]\".")
The Seventh National Population Census recorded China’s national population at 1,411.78 million in 2020. That number is a census benchmark. The NBS figure of 1,409.67 million at the end of 2023 is an official annual figure. They are not contradictory simultaneous totals: they refer to different years and were produced through different measurement processes.
| Figure type | Reference | Example | How to read it |
|---|---|---|---|
| Census count | 2020 | 1,411.78 million | Large-scale enumeration benchmark |
| Official annual figure | End of 2023 | 1,409.67 million | National year-end statistic |
| International estimate | 2025 | 1.41 billion | Rounded, model-based estimate |
| Projection | Future year | Scenario-specific | Assumption-based pathway, not a current count |
Differences can also result from coverage rules, administrative records, reference dates, revisions, and the treatment of people who are temporarily away from their usual residence. Before comparing two figures, record the source, reference date, population definition, and whether the number is counted, estimated, or projected.
China Population by Year: From Rapid Growth to Decline
China population by year shows a major demographic transition. The country moved from rapid population growth in the twentieth century to a total above 1.4 billion, followed by a recent shift into decline. The long-term rise and the recent fall are parts of the same transition, but they should be described with clearly labeled observations.
The Long-Term Population Growth Pattern
A consistent international population series is useful for viewing the broad historical pattern because it applies one modeling framework across many years. The World Bank series shows China’s population rising substantially from the mid-twentieth century to more than 1.4 billion. Official census benchmarks provide separate national reference points: the population had passed one billion by the early 1980s, reached 1,339.72 million in the 2010 census, and reached 1,411.78 million in the 2020 census.

For a clean China population by year chart, use one series from beginning to end. The World Bank Open Data series is appropriate for a consistent international comparison, while NBS census values are appropriate for explaining official enumeration milestones. Do not place a modeled 2025 estimate next to an official 2020 count without labeling the different definitions.
The main reason for the earlier rise was a demographic transition. Mortality declined as survival, public health, food supply, and living conditions improved, while fertility remained high for part of the transition. When deaths fall before births fall, each generation can be larger than the one before it. That imbalance produces rapid population growth even when fertility later begins to decline.
Over time, lower fertility changed the shape of the population. Smaller younger cohorts eventually reduced the number of potential parents, while people born during earlier high-growth periods moved into adulthood and later older age groups. This timing helps explain why a country can continue growing for a period after fertility has already fallen, then later experience both aging and population decline.
When China’s Population Began to Fall
The official evidence clearly records a national decline in 2023. The NBS reported that the population fell by 2.08 million people during that year. The immediate demographic arithmetic was natural decrease: deaths exceeded births. This is a statement about the annual national total, not a claim that every province, city, or rural area lost residents.

The timing of the population peak can vary slightly between sources because a census, a year-end statistic, and an international model may use different reference dates and methods. It is therefore better to say that China entered a documented population-decline phase by 2023 than to treat one annual change as proof of the exact size of every future decline.
A national decline also does not mean that population movement stopped. Some places can gain residents through internal migration while the national total falls. The useful distinction is between the country’s total change, which depends primarily on births, deaths, and net international migration, and local change, which is strongly affected by movement within China.
China Population Growth: Births, Deaths, and Migration
China population growth is determined by the balance between births and deaths, together with net migration across the country’s international borders. Internal migration does not change the national total, but it has a major effect on the distribution of people between rural areas, towns, and cities.
Lower Births and Below-Replacement Fertility
China recorded 9.02 million births in 2023, with a crude birth rate of 6.39 births per thousand people, according to the official annual statistics. These are observed annual indicators. The number of births tells us how many babies were born during that year, while the crude birth rate relates births to the size of the population.
Neither measure is the same as the total fertility rate. Total fertility rate is a model-based or survey-based estimate of the average number of children a woman would have over her lifetime under a specified set of age-specific fertility rates. A country can have a low number of births because it has fewer women in childbearing ages, even when the average number of children per woman has not changed by the same amount.
The long-term fertility decline reflects several documented influences. Birth-planning policy affected family size and the timing of births over several decades. Urbanization, longer education, delayed family formation, housing costs, employment pressures, and the direct and indirect cost of raising children can also reduce the number of children families plan to have. A change in formal policy does not immediately recreate larger younger cohorts or remove these economic and social pressures.
For that reason, a careful explanation should use the 2023 birth count and crude birth rate as observed evidence, while labeling any total fertility rate as an estimate and identifying its source and method. An exact current fertility rate should not be inferred from the annual number of births alone.
Mortality, Longevity, and Population Aging
China recorded 11.10 million deaths in 2023, with a crude death rate of 7.87 deaths per thousand people. The difference between 11.10 million deaths and 9.02 million births is approximately 2.08 million people, matching the reported annual decline. The NBS 2023 Statistical Communiqué provides the official annual evidence for these figures.
Natural decrease simply means that deaths exceed births during a period. It does not mean that mortality conditions suddenly became unhealthy. As more people survive into older ages, the number of deaths can rise because the population contains more older adults, even when people are living longer than previous generations.
Low fertility and improved survival work together to produce population aging. Smaller groups of children form a narrower base, while larger groups born in earlier decades move upward through the age structure. The result is a rising share of older people and a smaller pool of younger people available to enter the workforce in later years.
The Role of Migration
Migration should be separated into two categories. Net international migration measures people entering or leaving China across national borders and can affect the country’s total population. Internal migration occurs within China and changes where people live without directly changing the national total.
The official 2023 births and deaths figures already explain the reported 2.08 million natural decrease. The NBS annual release does not present international migration as the main cause of that decline. It is therefore not appropriate to describe migration as the primary driver of China’s population loss without a comparable migration series for the same year and population coverage.
Internal migration is more important for understanding regional distribution and urbanization. A person moving from a rural county to a city may increase the city’s resident population while reducing the rural area’s resident population, but the move does not add a person to China’s national total. Migration statistics should always state whether they measure permanent residence, usual residence, registration, temporary movement, or net international migration.
China’s Age Structure and Population Pyramid
Population totals alone do not show how many people are children, working-age adults, or older adults. China’s age structure is especially important because the country is experiencing low fertility, population aging, and a smaller number of young people entering adulthood.
Age Groups in the Latest Official Data
In the NBS 2023 classification, 17.6 percent of the population was aged 0 to 15, and 61.3 percent was aged 16 to 59. The remaining 21.1 percent was aged 60 or older under that classification. These categories describe broad official groups and should not be treated as identical to the international categories of ages 0 to 14, 15 to 64, and 65 or older.
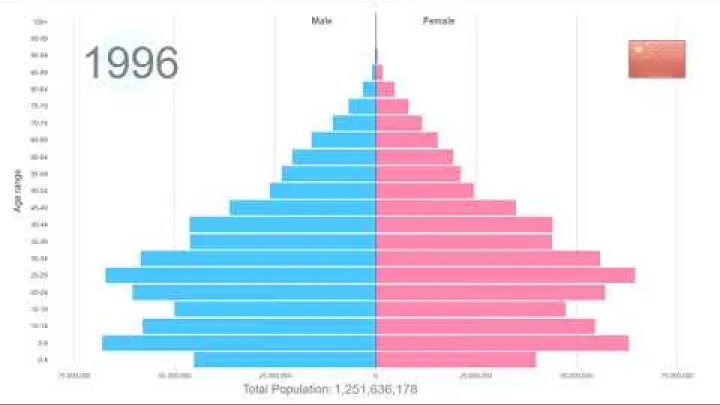
The 2020 census provides a separate aging benchmark: people aged 65 and over made up 13.50 percent of the population. The census results are available through the Seventh National Population Census. Because the 2020 and 2023 figures use different reference years and age classifications, they should be compared as separate indicators rather than combined into one age table.
A population pyramid represents these groups by age and sex. When the base is narrower than the middle, it indicates that younger cohorts are smaller than many adult cohorts. In China’s case, lower birth numbers make the base narrower, while the movement of large older cohorts into retirement ages makes the upper sections more prominent.
Aging and Dependency Pressures
Aging changes the balance between people who are typically in education or retirement and people in working ages. A smaller child population can reduce some near-term demand for schools, while a larger older population can increase the need for pensions, medical services, accessible housing, and long-term care.
These changes also affect families. When there are fewer adult children relative to older parents, family support responsibilities can become more concentrated. Employers, local governments, health-care providers, and households may all need to adapt to a population with a different age distribution.
Population aging and total population decline are related but separate processes. A country can age while its total population still grows, and it can continue aging after the total begins to fall. Age shares, fertility, survival, and migration should therefore be analyzed separately rather than reduced to one dependency ratio.
Urbanization, Population Density, and Regional Distribution
China’s population is not distributed evenly across its territory. Urbanization has brought a larger share of residents into cities and towns, while national density averages conceal strong differences between the eastern coastal region, major urban belts, and sparsely settled parts of western China.
Urban and Rural Population Shares
At the end of 2023, China had 932.67 million urban permanent residents and 477 million rural permanent residents. The official urbanization rate was 66.2 percent. The figures and rate are reported in the NBS 2023 Statistical Communiqué.
The 2020 census reported an urban share of 63.89 percent under its census framework. This comparison suggests continued urbanization between 2020 and 2023, but the reference dates and statistical procedures must remain visible. A percentage of permanent residents is not automatically the same as a count of everyone who is temporarily working, studying, or staying in a city.
Urbanization also changes the meaning of local population figures. A city’s administrative population may include suburban or rural areas, while a metropolitan-area figure may cover several jurisdictions. For comparisons among cities, use figures with the same boundary and residence definition.
Why National Density Hides Regional Differences
The national average is useful for international comparison, but it does not describe the experience of living in every part of China. The World Bank population-density indicator measures people per square kilometre of land area and lists 2023 as the latest year in the supplied series. It puts China’s national average at roughly 150 people per square kilometre in 2023, rounded for explanation. The relevant series is World Bank Population Density Data.
Eastern coastal provinces and large urban belts generally have much higher settlement densities than broad areas of western China. Mountainous, plateau, desert, and border regions can contain large land areas with relatively few residents, while concentrated city regions contain many people in a smaller space. These contrasts are why a national average should not be used to estimate the density of a particular province or city.
Density comparisons also depend on the denominator. A country-level indicator uses national land area, a province uses its administrative area, and a city may use either its full administrative boundary or a built-up urban area. Before quoting a density figure, identify the year, population estimate, land-area denominator, and boundary used.
China Population Growth Projections
Population estimates and projections answer different questions. An estimate describes a recent or historical population using observed data and demographic modeling. A projection extends that model into future years under stated assumptions. Both can be useful, but neither should be presented as a new census count.
Estimates Versus Projections
The 2025 World Bank figure of about 1.41 billion belongs to the estimate category in this article. It is a rounded value for a recent reference year, not a real-time counter and not a direct enumeration. The 2020 census count is a different kind of observation, and the NBS 2023 figure is an official year-end statistic.
A projection begins with a base year and applies assumptions about fertility, mortality, life expectancy, and migration. Different assumptions can produce different future paths. For example, a projection with faster fertility recovery will differ from one that assumes fertility remains low, even if both start with the same population estimate.
Every future number should therefore be labeled with its base year, scenario, revision, and assumptions. A projection can show what may happen under a defined demographic pathway, but it cannot replace the latest observed or estimated population figure.
What the Demographic Direction Suggests
The observed direction is clear: sustained low fertility, population aging, continued urbanization, and a transition away from long-term population growth. The 2023 natural decrease connects the annual births and deaths data to the broader shift in the total population.
Future contraction should be described conditionally. Under a specified projection scenario, continued low fertility and aging could lead to further decline, but the size and timing depend on fertility, mortality, and migration assumptions. The by-year population series, natural decrease, age structure, and urbanization are therefore best read as connected parts of a demographic transition rather than as isolated statistics.
Conclusion: China’s Population Has Entered a New Phase
China has about 1.41 billion people according to the latest listed 2025 international estimate, while the latest official annual benchmark used here is 1,409.67 million at the end of 2023. The 2020 census, annual NBS statistics, and international estimates are valuable for different purposes and should not be combined without labeling their definitions and reference years.
After decades of rapid growth, lower births and an aging population have produced a documented national decline, even as urbanization continues and regional population patterns remain highly uneven. Understanding China’s population therefore requires more than one total: it requires attention to the year, measurement method, age structure, urbanization, density denominator, and assumptions behind any projection.
Select area
Create a post
Posting is free and no registration is required.