Singapore Population: 2025 Figure, Growth & Demographics
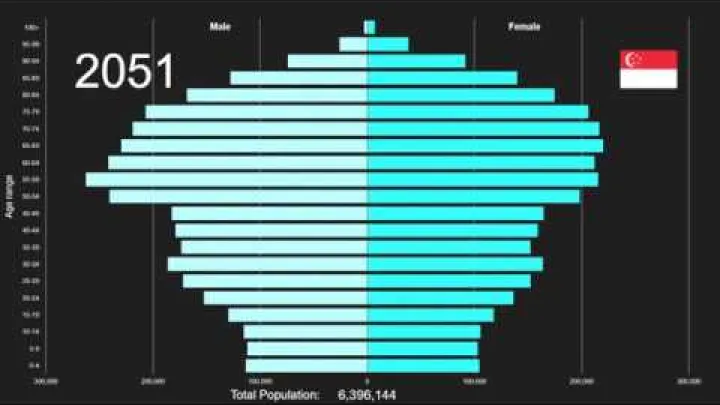
Singapore’s latest official population was 6.11 million people at end-June 2025. This total includes citizens, permanent residents, and non-residents, so it is important to understand which group a statistic describes. Singapore is a compact, fully urbanised city-state where even modest population changes can matter for housing, transport, services, and labour planning. This guide explains the population of Singapore, recent and long-term growth, demographic structure, population density, and the uncertainty around future projections.
Because Singapore’s official population releases use an end-June reference date, the 2025 figure is best read as a national estimate for that point in time rather than a live count. It answers the broad question “how many people live in Singapore?” while resident-only figures are more appropriate for many demographic comparisons. Keeping the date and population category visible prevents a census result, an annual estimate, and a future projection from being mistaken for the same measurement.
How Many People Live in Singapore?
The most useful answer depends on the date and the statistical definition. For a current national overview, Singapore’s official end-June population estimate is the clearest starting point. Detailed census data, international databases, and future projections serve different purposes and should not be treated as interchangeable figures.
Singapore's Latest Official Population Figure
Singapore’s total population stood at approximately 6.11 million at end-June 2025. This is the latest confirmed official figure in the available national release, and it was 1.2% higher than the June 2024 total. The figure is an annual official population estimate, not a new full census headcount.
For most practical questions about how many people live in Singapore, the 6.11 million estimate is the appropriate headline number. It is published in Population in Brief 2025, which reports the total and its major population components on the same end-June reference date.
International databases may display a more precise-looking total, such as a figure carried to individual persons. That precision does not mean it is more suitable for every purpose: it may reflect a different reference date, estimation method, or revision cycle. When describing Singapore’s current population in general terms, it is clearer to use the rounded official figure and state its date.
The headline total is most useful for understanding the overall population present in the country. It can inform broad questions about the scale of the housing market, transport demand, workplaces, and public infrastructure. It should not automatically be used to calculate indicators that are defined for residents, citizens, or a particular age group. Those measures require the corresponding population denominator.
Residents, Citizens, Permanent Residents, and Non-Residents
At end-June 2025, the total population comprised about 4.20 million residents and 1.91 million non-residents. In Singapore’s official classification, residents are Singapore citizens and permanent residents combined. Non-residents are a separate category and are included in the national total population.
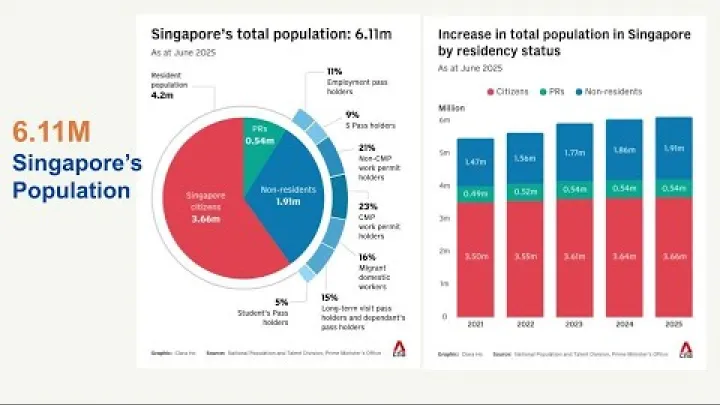
| Population group | End-June 2025 | Meaning |
|---|---|---|
| Total population | 6.11 million | Residents plus non-residents |
| Residents | 4.20 million | Citizens plus permanent residents |
| Non-residents | 1.91 million | People present under non-resident arrangements |
The non-resident category includes people in Singapore for documented purposes such as employment, study, or family-related arrangements. It is not a synonym for “immigrant,” “foreign-born,” or “foreigner.” Those terms can refer to different concepts, while non-resident status is an official population classification.
This distinction is important because the resident population is used for many social and demographic indicators, including detailed age and ethnic statistics. The total population is more useful when considering the number of people who may need homes, transport, workplaces, public spaces, or other services in Singapore. The official definitions and latest totals are available through SingStat population statistics.
The categories also explain why different headlines can appear to describe different population trends. Citizens and permanent residents form the more established resident base, while the non-resident total can respond more quickly to employment, study, border-mobility, and policy conditions. A change in the national total therefore does not necessarily mean that the citizen population changed by the same amount.
Census Counts, Official Estimates, and Projections
Singapore’s Census 2020 is a detailed snapshot of the population at a particular point in time. It provides rich information on subjects such as households, religion, education, transport, and geographic distribution. Annual population figures released after the census are official estimates built from administrative records and statistical methods, rather than a repeat of the full census process.
It helps to use direct labels when comparing numbers. A census count describes the population measured in a census. An official mid-year or end-June estimate describes the nationally released total for that date. An international estimate, such as one from the United Nations or World Bank, is a separately constructed statistical series. A projection is a modelled future path, not an observed count.
Before comparing two Singapore population figures, check the reference year and the type of figure. A 2020 census statistic, a 2025 official estimate, an international estimate, and a 2050 projection answer different questions. Combining them can create a number that appears current but is not based on one consistent definition or date. The Census 2020 material is particularly useful for understanding the breadth of information a census can provide.
A census is especially valuable for detailed characteristics that are not collected in the same way every year. An annual estimate is better suited to tracking the changing total and broad resident or non-resident categories. An international series is useful for comparisons across countries, but its methods may smooth, revise, or model national data differently. Projections should be read as conditional scenarios based on assumptions, not as promises about Singapore’s eventual population.
Singapore Population by Year and Growth Trend
Singapore’s population has grown substantially over the long term, but the pace has varied. Recent changes reflect recovery in international mobility after the pandemic as well as longer-running demographic pressures, including low fertility and population ageing.
Recent Population Change from 2023 to 2025
The official end-June series shows a clear recent rise: about 5.92 million in 2023, 6.04 million in 2024, and 6.11 million in 2025. The increase from 2023 to 2024 was about 120,000 people, while the increase from 2024 to 2025 was about 70,000 people.

| Reference date | Total population | Change from previous year |
|---|---|---|
| End-June 2023 | About 5.92 million | About 5.0% growth from 2022 |
| End-June 2024 | 6.04 million | About 120,000; 2.0% |
| End-June 2025 | 6.11 million | About 70,000; 1.2% |
The stronger 2023 increase followed a period in which cross-border movement and the non-resident population had been disrupted by the pandemic. Growth then moderated in 2024 and 2025. This pattern should not be read as a permanent annual rate: one or two years can be strongly affected by reopening, labour demand, changes in international student numbers, and the return of workers.
The 2025 report also describes an annualised population growth rate of 1.5% over the previous five years. That longer measure gives more context than a single year, but it still reflects an unusual period that included pandemic disruption and recovery.
Looking at both measures is useful. The percentage rate shows how quickly the population changed relative to its earlier size, while the absolute increase shows the additional number of people represented by that rate. In a population of roughly six million, a modest percentage can still represent tens of thousands of people, with potential effects on demand for homes, transport, schools, healthcare, and other services.
Long-Term Population Growth from 1950 to the 2020s
In broad terms, Singapore’s population rose from roughly one million people around 1950 to more than six million by the mid-2020s. The increase accompanied major economic, social, and urban change in a small island state with limited land area.
The early post-war decades and industrialisation period saw rapid growth. Later, Singapore experienced a major fertility transition, with family sizes falling sharply from earlier levels. In more recent decades, total population growth has been slower and more variable, shaped by low natural increase and by changes in resident and non-resident numbers.
A long-run series is best used to understand direction rather than to imply that every historical value is identical in method. Definitions, data systems, national boundaries of statistical categories, and international estimation techniques can change over time. The United Nations World Population Prospects 2024 dataset offers a consistent international series from 1950 onward, but it remains distinct from Singapore’s own end-June official releases.
The long-term increase reflects several different phases rather than one uninterrupted growth rate. Population expansion accompanied industrialisation and employment creation, while later decades brought lower fertility and a more mature age structure. International mobility also became a more important influence on the total. These changes mean that the reason for growth in the 1950s or 1960s cannot simply be assumed to explain the slower and more policy-sensitive growth of the 2020s.
What Drives Singapore Population Growth?
Population change has three broad components: births relative to deaths, movements into and out of the population, and changes in the number of residents and non-residents present in Singapore. In a country with very low fertility and a large internationally connected economy, these components can have very different short-term effects.
Recent total population growth has been influenced strongly by the non-resident population. After pandemic restrictions eased, international movement resumed and the non-resident population increased. In the year to June 2025, the non-resident total rose from about 1.86 million to 1.91 million. This helps explain why the total population can rise even when the resident population changes more gradually.
Natural increase is constrained when births are low and the population is older. Migration and non-resident flows can respond more quickly to employment needs, border conditions, education demand, and policy settings. Therefore, it is not accurate to assign every annual increase to one cause. Singapore population growth is best understood as the combined result of these changing components.
The timing of each component matters. Fertility affects the number of children and, over a longer period, the future working-age population. Mortality and longevity alter the age structure gradually. Migration and non-resident flows can change the total more quickly, particularly when economic conditions or international travel patterns shift. This is why a short-term population increase does not by itself demonstrate a reversal of Singapore’s longer-term fertility and ageing trends.
Singapore's Population Structure and Demographic Change
The headline total does not show how Singapore’s population is distributed by age, sex, ethnicity, citizenship status, or other characteristics. These details are central to planning because a population of the same size can have very different needs depending on its structure.
Ageing, Fertility, and Natural Increase
Singapore is a rapidly ageing society. Longer life expectancy means more people live into older age, while sustained very low fertility means there are relatively fewer births than in earlier generations. Together, these trends change the balance between younger, working-age, and older residents.

Low fertility limits the contribution of births to future population growth. As the population ages, deaths also make up a larger part of demographic change. This does not mean that the total population must immediately decline, because migration and the non-resident population can alter the total. It does mean that natural increase alone is less able to support growth than it was in earlier decades.
For public planning, ageing affects demand for healthcare, care services, accessible housing, retirement income arrangements, and labour-force adaptation. For employers and households, it also increases the importance of productivity, skills development, flexible work arrangements, and support for caregivers. Fertility, mortality, and migration should be considered together rather than as separate explanations for one simple outcome.
Age and fertility indicators should be read with their reference year and population coverage. A fertility measure generally describes births in relation to a defined population of women or residents, while an age indicator may show the distribution of residents at end-June. Readers looking for the newest official series can consult Population Trends 2025 alongside the annual population tables. These measures describe demographic structure; they are not direct forecasts of the total population.
Age, Sex, Ethnicity, and Religion
Singapore’s official data allow population structure to be examined by age group, sex, and ethnic group, especially for residents. The SingStat resident tables are updated annually at end-June and provide a more current view of these categories than a census-only table. Detailed data can be explored through Data.gov.sg population tables.
For detailed characteristics such as religion, household arrangements, literacy, and some social patterns, Census 2020 remains an important reference point. In that census, the resident population included Chinese, Malay, Indian, and Other ethnic groups. The census recorded Chinese residents as the largest group, followed by Malay and Indian residents, with a smaller Other category. These are resident composition measures, not a description of every person in the 2025 total population.
Religion is also measured in census material and should be read with the same care. Singapore has a religiously diverse resident population, including Buddhist, Christian, Muslim, Taoist, Hindu, other religious, and no-religion groups. Census-based shares describe the census reference year and population coverage. They should not be presented as if they were a newly measured breakdown of the entire 2025 population.
Age and sex figures require similar precision. A statistic may cover residents rather than all people in Singapore, and it may refer to end-June in a stated year. Labeling the population group and date makes demographic comparisons meaningful and avoids treating older structural information as a current total.
These categories can also be combined to answer more specific questions, such as how the resident age structure differs by sex or how ethnic composition is reported in the census. Such comparisons should use the same denominator and reference year. A percentage for residents cannot be multiplied by the 2025 total population to produce a current count unless the source explicitly supports that calculation.
Citizenship, Permanent Residency, and the Non-Resident Population
Citizenship, permanent residency, and non-resident status are related but different legal and statistical categories. Singapore citizens and permanent residents together form the resident population. A permanent resident is not the same as a citizen, and a non-resident is not simply anyone born outside Singapore.
Resident statistics are often the main basis for assessing long-term demographic composition because residents have a more stable connection to Singapore’s population base. The total population adds people who are present for work, study, family, and other authorised purposes. That total better reflects the number of people living in and using the city-state at a given time.
This difference explains why two statements can both be true: the resident population may change steadily, while the total population moves more sharply when non-resident numbers rise or fall. For readers relocating for work or study, the distinction is useful because population headlines may reflect changes in a broad range of temporary and longer-term population groups, not just changes in citizenship.
For example, a resident-focused statistic is generally the relevant starting point for studying household composition or the age profile of the settled population. A total-population figure is more relevant to estimating the broad scale of daily demand on housing, transport, workplaces, and public services. The correct choice depends on the question, not on which number is larger.
Urbanisation and Population Density in Singapore
Singapore’s geography makes population density and urban planning especially important. Unlike a large country with many rural regions and separate major cities, Singapore is a single city-state with highly integrated land, transport, housing, and economic systems.
Singapore as a Fully Urbanised City-State
International datasets generally classify Singapore’s urban population share as effectively 100%. This describes the share of people living in areas defined as urban; it does not mean every part of Singapore has the same built form, land use, or building density.
Singapore does not have a substantial rural population that is gradually moving into cities in the way seen in many larger countries. Its urban population growth is instead closely tied to changes in the overall population within a compact and highly developed territory. The World Bank’s urban population data provide this international urbanisation context.
This city-state setting has practical consequences. Population change takes place within one connected metropolitan system, so it can affect commuting, housing supply, school places, healthcare capacity, utilities, green space, and neighbourhood services at the same time. Urbanisation statistics are useful context, but they do not by themselves measure crowding, quality of life, or access to amenities.
The 100% classification is therefore a broad statistical description, not a statement that every parcel of land is built up or that all residents experience the city in the same way. Industrial areas, parks, reservoirs, coastal areas, transport corridors, and lower-density spaces remain part of the national land-use pattern. Urban population share and population density answer related but different questions.
Singapore Population Density and Land Area
Population density measures the number of people per square kilometre of land area. With more than six million people living on a relatively small land area, Singapore is among the world’s most densely populated countries. Depending on the source, reference year, and land-area measure used, recent figures are generally above 8,000 people per square kilometre of land area.

A density figure must match its inputs. Some sources use an internationally standardised land-area series and an internationally estimated population. Others may use Singapore’s own reported land area and official end-June population estimate. Land reclamation, water area treatment, rounding, and the selected population date can all create differences between published density values.
For internationally comparable figures, use one consistent series such as the World Bank population density data. If calculating a density from Singapore’s official population total, state the population date and land-area source alongside the result. A density based on a later estimate should not be compared as though it were identical to a published earlier-year indicator.
The national average also conceals differences within the city-state. People, jobs, housing, and transport demand are not distributed evenly across every district or land-use type. Local planning decisions therefore need more detailed geographic data than a single country-level density value can provide.
Why Population Density Matters for Planning
High density does not automatically mean poor living conditions. It does, however, require long-term coordination across land use, housing, transport, water and energy systems, healthcare, education, public spaces, and environmental management. In Singapore, these services operate within a limited physical area and a highly connected urban network.
Small annual population changes can have meaningful planning implications when they are concentrated in particular age groups, employment sectors, or locations. More older residents may affect healthcare and accessibility needs; more working-age residents or non-residents may influence commuting and housing demand; and changes in household patterns can affect the type of homes needed.
Density should therefore be understood as a planning condition rather than a simple measure of whether a place is liveable. Well-designed transport, housing, public facilities, and green spaces can shape how density is experienced, while population totals alone cannot show local differences between neighbourhoods.
Planning decisions also depend on timing and capacity, not only on the number of people. A stable national total could still require new facilities if the age profile changes or if population growth is concentrated in a particular area. Conversely, a higher total does not automatically indicate overcrowding. Density statistics are most useful when interpreted alongside land use, infrastructure provision, household size, and the distribution of services.
Singapore Population Projections and Future Outlook
Future population figures are necessarily less certain than current estimates. They are useful for examining possible demographic paths, but they depend on assumptions that may change, particularly in a country where migration can affect total population relatively quickly.
What UN Projections Suggest About Singapore's Future Population
The UN medium-variant outlook in the 2024 revision indicates a possible path in which Singapore’s population rises toward a peak around the 2030s or 2040s and then declines. This is a projection scenario, not a forecast that guarantees one exact result.
The projected path reflects assumptions about fertility, mortality, and international migration. For Singapore, migration assumptions are especially influential because changes in work, study, and residency flows can alter the population more rapidly than changes in fertility. The scenario should also be kept separate from the official 6.11 million end-June 2025 estimate, which is an observed national figure.
Readers using future figures for business, education, relocation, or planning should treat them as a range of plausible demographic directions rather than a fixed destination. The UN’s World Population Prospects 2024 projections are valuable for long-run comparison, but every future value remains conditional on the model’s assumptions.
When using the UN dataset, select the medium variant and note the projection year shown in the table or chart. A projected peak in a broad period does not establish the exact year or size of the peak under every possible scenario. Later revisions may also change the path as new information about births, deaths, and migration becomes available.
How Fertility, Ageing, and Migration Could Change the Outlook
If fertility remains well below replacement level, births are unlikely to provide strong natural population growth over the long term. Population ageing can further slow natural increase as the age structure changes. Improvements in survival can increase longevity and the number of older people, even where total population growth is modest.
Migration is the variable most likely to alter the overall population and working-age population over a shorter period. Its effect depends on labour demand, international mobility, education patterns, residency pathways, and public policy. Changes in these conditions may increase, slow, or reverse population growth relative to a projection scenario.
No distant total should be treated as certain. A sound reading of Singapore’s demographic outlook considers several mechanisms at once: low fertility, longer lives, the changing age structure, and migration. It also recognises that policies, economic conditions, and social choices can shift the path over time.
For near-term decisions, the latest official annual estimate is more informative than a distant projection. For long-term planning, projections are useful precisely because they show how different assumptions could affect demand for workers, healthcare, housing, education, and infrastructure. Readers should match the source and scenario to the decision they are making rather than treating one projected number as Singapore’s inevitable future.
Key Takeaways About Singapore's Population
Singapore had an official total population of 6.11 million at end-June 2025, including 4.20 million residents and 1.91 million non-residents. The total rose in recent years, with strong post-pandemic recovery followed by slower growth in 2025.
Singapore’s long-term demographic story combines a large historical population increase with very low fertility, longer life expectancy, and rapid ageing. Its fully urbanised, high-density city-state setting makes population structure as important as the headline total.
For a reliable comparison, always identify whether a figure is a census count, an official estimate, an international estimate, or a projection. That simple distinction makes it easier to understand how many people live in Singapore now and how its population may change in the future.
Select area
Create a post
Posting is free and no registration is required.