Hong Kong Population: 2025 Figure, Trends, Density & Outlook

How many people live in Hong Kong? The latest figure shown by Hong Kong's Census and Statistics Department is 7,510,800 people at year-end 2025, or about 7.51 million. This is a dated population figure for the Hong Kong Special Administrative Region, not a live count of everyone physically present and not the population of mainland China. The guide below explains what the number includes, how the Hong Kong population has changed by year, why estimates can differ, how density varies across the territory, and what ageing and official projections indicate.
How Many People Live in Hong Kong?
Hong Kong's population is best understood through official figures tied to a reference date. The latest year-end figure gives the clearest direct answer, while mid-year estimates, census benchmarks, and projections answer different questions.
The latest official Hong Kong population figure
At year-end 2025, Hong Kong had a reported population of 7,510,800. Rounded for everyday use, that is approximately 7.51 million people. The figure appears in the population statistics of the Census and Statistics Department, Hong Kong's official statistics authority.
The words at year-end 2025 are essential. They identify when the estimate applies and prevent the number from being mistaken for a real-time counter. A population can change between the beginning and end of a year through births, deaths, and movement across Hong Kong's borders, so a dated estimate is more precise than simply saying that Hong Kong has 7.51 million residents.
The geographic scope is also specific. This figure describes the population of Hong Kong, officially the Hong Kong Special Administrative Region. It does not describe mainland China, the wider Pearl River Delta, or the combined population of Hong Kong and nearby cities. When using the figure in a report, article, application, or comparison, retain the year-end 2025 reference and any provisional or revised status attached to the particular C&SD release.
What Hong Kong population statistics include
C&SD population estimates use the Hong Kong Resident Population concept. This concept includes the two statistical groups called Usual Residents and Mobile Residents. In plain language, the measure is designed to represent people who meet Hong Kong's statistical residence rules, including residents whose presence in the territory varies during the reference period.
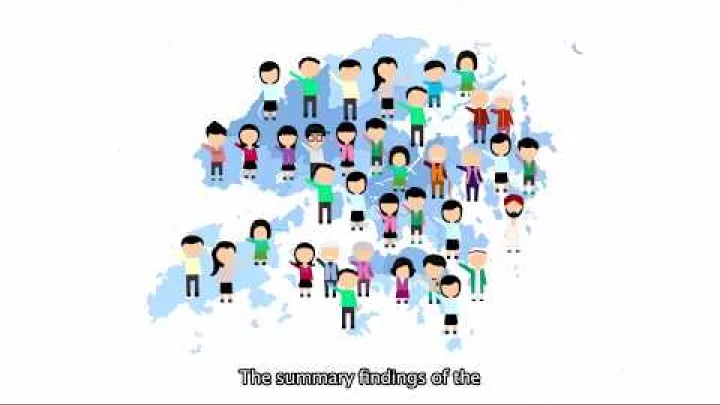
That means a resident population estimate is not identical to the number of people physically inside Hong Kong at one particular moment. Visitors may be present without belonging to the resident population, while a resident who is temporarily away may still be covered by the relevant statistical concept. The purpose is to measure the resident population consistently over time, rather than to count people entering and leaving on a particular day.
Three types of population figure should be kept separate:
- A census count is collected during a census or by-census operation and provides a detailed benchmark for a particular census period.
- An annual or mid-year estimate updates the population between census benchmarks and is tied to a stated date and statistical status.
- A projection is a forward-looking result based on assumptions about fertility, mortality, and movement. It is not a current population count.
These categories can describe the same population in broad terms, but they are not interchangeable. A census benchmark should not be inserted into an annual estimate series without identifying its method, and a projection should never be used as evidence of how many people live in Hong Kong today.
Why different sources report slightly different totals
Different Hong Kong population figures can be correct even when they are not identical. The most common reason is that they refer to different dates. A mid-year estimate describes the population around the middle of a year, while a year-end figure describes the position later in that year. A difference between them may therefore reflect ordinary movement during the year rather than a contradiction.
The following comparison shows why the date and statistical status should be read alongside the number.
| Figure | Reference date | Source type | Status |
|---|---|---|---|
| 7,524,100 | Mid-year 2024 | Population estimate | Revised |
| 7,527,500 | Mid-year 2025 | Population estimate | Provisional |
| 7,510,800 | Year-end 2025 | Population figure | Year-end entry |
C&SD's C&SD Population Estimates material also illustrates the importance of revisions. A previous estimate may be updated when more information becomes available or when the department revises the statistical series. The word provisional signals that a figure may still be adjusted, while revised signals that an earlier figure has already been updated.
Small differences can also arise from the population concept used, the release calendar, and the methods used by international databases. Some international series may harmonize national statistics or interpolate between dates. The practical rule is simple: before comparing any two Hong Kong population figures, check the reference date, the population concept, and whether each number is a census count, an estimate, a projection, provisional, or revised. Do not combine values from different years to create a total that appears more current than the underlying data.
Hong Kong Population by Year and Recent Growth
Hong Kong's population history shows a long-term increase followed by much slower and more uneven recent change. A useful population-by-year overview must identify whether each entry is an annual estimate or a census benchmark.
The long-term population trend
Over the longer term, Hong Kong's population rose from approximately 5.59 million in 1988 to approximately 7.12 million in 2018. These figures are useful historical reference points because they show the broad direction of change across three decades. They should not be treated as a complete annual series unless every intervening year is taken from the same C&SD statistical table and concept.
| Year | Population figure | How to read it |
|---|---|---|
| 1988 | About 5.59 million | Historical population context |
| 2018 | About 7.12 million | Historical population context |
The broad rise was not the result of one constant annual growth rate. Hong Kong moved from periods of faster population expansion to a more mature demographic pattern in which births became fewer, the population aged, and changes in migration flows had a larger effect on year-to-year totals.
The 2016 and 2021 Population Censuses are separate benchmarks. They are especially valuable for examining age, household, and other structural characteristics, but they should not be placed into an annual population-estimate table without confirming that the population definitions and reference dates match. This distinction keeps a long historical trend from mixing different statistical products.
Recent decline, recovery, and near-zero growth
From roughly 2019 onward, Hong Kong's population pattern became more volatile than the earlier long-term rise. The pandemic period was associated with population declines, while the later reopening period brought stabilization and, in some measures, modest recovery. The exact result depends on whether the comparison uses mid-year or year-end estimates.

The provisional mid-year 2025 estimate was 7,527,500, and C&SD described the population as virtually unchanged compared with the comparable earlier mid-year figure. That wording points to near-zero short-term growth rather than a rapid expansion. It also shows why a small movement in the total should not automatically be described as a major demographic reversal.
A mid-year series and a year-end series can point in different directions because they observe different points in the calendar. The year-end 2025 figure of 7,510,800 is therefore not a direct replacement for the mid-year figure and should not be used to calculate an annual decline without matching dates and definitions. Overall, recent data support a description of pandemic-era decline followed by stabilization or near-zero growth, not an unsupported claim of a sustained population collapse.
What drives annual population change
The basic demographic accounting relationship is:
Population change = births minus deaths plus net movement into or out of Hong Kong.
Births add to the resident population and deaths reduce it. The difference between the two is called natural change. Net movement includes the balance between people who move into Hong Kong and residents who leave or are no longer included under the relevant resident-population rules. In a place with low fertility and an ageing population, natural change can become weak or negative, making migration flows more important to the annual total.
Hong Kong's major documented influences therefore include low fertility, population ageing, and changing movement across the border. Fertility affects the size of younger cohorts and has its strongest effect over a longer period. Ageing and longer survival change the balance between deaths and births gradually. Migration can produce a more immediate change in a particular year, especially when travel, employment, education, or residence patterns shift.
These components should be used to explain the structure of the trend, not to assign a single cause to every annual movement. Unless C&SD provides a specific decomposition for a particular year, it is safer to describe the main demographic forces than to claim that one factor alone produced that year's increase or decrease.
Population Density and Urbanization in Hong Kong
Hong Kong's population is concentrated in a highly urbanized settlement pattern, but the territory-wide average does not describe every neighborhood. Density depends on both the number of residents and the land-area denominator used in the calculation.
How dense is Hong Kong?
Hong Kong has a high territory-wide population density measured in thousands of residents per square kilometre. For a formal figure, the most reliable source is C&SD's table for Population Density by District. It reports land area, land population, and population density together, allowing the population date and land denominator to be read as one statistical set.
A headline density number is meaningful only when its denominator is clear. Territory-wide density uses the land area of the whole territory, while a calculation based only on developed or inhabited land will be much higher. Similarly, a current population estimate should not be combined with an unrelated land-area series simply to produce a precise-looking current density. For comparisons, use values from the same reference period and the same definition of land area.
Density also differs from the experience of crowding. A territory-wide average includes land with few or no permanent residents, while many residents live in compact urban districts and high-rise buildings. The average is useful for comparing places and planning infrastructure, but it does not mean that every street, estate, or district has the same population concentration.
Where people live and why density varies
Hong Kong's settlement pattern can be understood through three broad local anchors: Hong Kong Island, Kowloon, and the New Territories. The official district framework divides the territory into 18 District Council districts, which provides a more useful level for comparing population distribution than a single territory-wide average.
Hong Kong Island and Kowloon contain many established urban areas with extensive high-rise housing and concentrated commercial activity. The New Territories include dense new towns as well as more dispersed settlements and larger areas that are less developed. These broad descriptions do not mean that every part of one region has the same density. A district may contain a very concentrated town centre alongside open land or low-density areas.
Land availability is a major reason for this variation. Country parks, rural areas, reservoirs, infrastructure corridors, and other less-developed spaces occupy part of the territory but do not accommodate residents in the same way as a high-rise residential district. Conversely, a small developed area can house a large population when homes, transport, schools, and services are built vertically and close together.
The C&SD district table is therefore useful for answering local questions such as where population is concentrated or how land area affects the district average. It should not be used on its own to make claims about housing affordability, quality of life, or how crowded a district feels. Those questions require separate evidence about homes, jobs, transport, and daily activity.
Age Structure, Fertility, and Population Ageing
The number of people in Hong Kong is only one part of the demographic picture. The age structure has changed substantially, affecting the balance between children, working-age adults, and older residents.
Hong Kong's current age structure
The 2021 Population Census provides an important benchmark. It recorded a median age of 46.3 years in 2021, compared with 43.4 years in 2016. The median age is the point at which half the population is younger and half is older, so an increase indicates that the population as a whole has become older.
The same census comparison shows the overall dependency ratio rising from 373 to 438 per 1,000 working-age persons between 2016 and 2021. This ratio counts people aged under 15 and people aged 65 and over in relation to the working-age population. It is a planning indicator, not a measure of how many dependants live in each household and not a direct measure of financial support.
Together, the higher median age and higher dependency ratio point to a shift toward a larger older population and a relatively smaller share of children and working-age people. The 2021 Population Census is the correct source for these census benchmarks. They describe the structure recorded in 2016 and 2021, not a direct count of the current 2025 age distribution.
C&SD also maintains annual population-by-sex-and-age tables, which can be used when a reader needs an estimate for a more recent year. Those annual values should be labeled as estimates and should not be blended with census indicators without explaining the difference in source and date.
How quickly Hong Kong's population is ageing
An earlier government analysis of Hong Kong's ageing trend used a 2016-based projection framework. Under that analysis, the population aged 65 and over was projected to increase from 1.27 million in 2018 to 2.44 million in 2038, if the assumptions held. The analysis also projected especially rapid growth among people aged 75 and over, from 0.57 million in 2018 to 1.40 million in 2038.
These values describe the projected size of older age groups, not their current number. The size of an elderly population and its share of the total population are related but different measures. A group can grow in number while its share changes at a different pace depending on what happens to the rest of the population. The analysis described the elderly population's size and share as increasing substantially over the period.
The same ageing analysis used the elderly support ratio as a planning indicator. In simple terms, this asks how many working-age people there are in relation to older people. A declining ratio means that fewer working-age people may be available relative to each older resident, which matters for health services, care, housing, labour supply, and public finance.
The Population Ageing Trend of Hong Kong analysis is an earlier projection, not a current population count. Whenever one of its figures is quoted, the base year, projection horizon, and projected status should appear in the same explanation. The figures are useful for understanding the direction and scale of ageing, but they should not be presented as guaranteed outcomes.
Low fertility and long life expectancy as structural forces
Fertility and longevity help explain why Hong Kong can have a large population while its age structure becomes older. The total fertility rate is a period measure that estimates the average number of children a woman would have if the birth rates observed in a particular period continued throughout her reproductive years. It is not a count of births in one year and does not predict the choices of any individual family.
Hong Kong's fertility has remained far below the level commonly associated with population replacement. C&SD reported that the total fertility rate reached a low of 0.701 in 2022 and then rose for two consecutive years after society returned to more normal conditions. That short-term recovery should be interpreted within the longer low-fertility trend. A rise from a very low point does not by itself indicate a return to high fertility or an immediate increase in the number of children.
Long life expectancy also contributes to ageing because more people survive into older age groups. At the same time, low fertility narrows the younger cohorts entering schools and, later, the labour force. These forces work over different time scales: fertility changes the base of the age structure, while longer survival increases the number of people reaching older ages. Neither factor alone determines the total population because migration and other demographic components also matter.
The C&SD Fertility Analysis is useful for separating a short-term movement in the fertility rate from the longer structural pattern. The main demographic implication is that even near-zero population growth can occur alongside continuing ageing and a changing balance between younger and older residents.
What Official Population Projections Show
Population projections extend the demographic story beyond the latest estimate. They are useful for planning, but they should be read as conditional scenarios rather than promises about the future.
How to interpret Hong Kong's population outlook
C&SD's official projection indicates that the Hong Kong Resident Population could reach 8.19 million in mid-2046. The projection series describes the resident population as generally maintaining an upward trend over the projection period. The mid-2046 date matters: 8.19 million is a projected population for that future point, not the latest figure for Hong Kong and not a count of current residents.

Population projections depend on assumptions about fertility, mortality, and migration or other population movement. If births remain different from the assumed path, if survival changes, or if more or fewer people move into or out of Hong Kong, a later projection can change. Official statistical methods can also be updated as new evidence becomes available.
The outlook is therefore best understood in two layers. In the short term, Hong Kong's total population may remain broadly stable, with small declines or increases around a large base. Over a longer horizon, the total could rise under the official projection while the age structure changes considerably. A growing or near-stationary total does not mean that the population's needs, workforce balance, or demand for services will remain unchanged.
The Hong Kong Population Projections page provides the official projection framework. The most important reading habit is to keep the current estimate, historical census benchmark, and future projection in separate categories. That distinction prevents a future scenario from being mistaken for a present-day population count.
Conclusion: What the Hong Kong Population Figure Shows
Hong Kong's latest reported population is 7,510,800 at year-end 2025, or about 7.51 million. The long-term trend has been upward, but recent change has been much slower and was interrupted by pandemic-era declines. Hong Kong remains highly urbanized and densely settled, although population concentration differs across Hong Kong Island, Kowloon, the New Territories, and the 18 District Council districts.
The most important demographic change is not only the size of the population but its age structure. The 2016 and 2021 census benchmarks show a rising median age and dependency ratio, while low fertility and long life expectancy support continued ageing. C&SD's projection of 8.19 million by mid-2046 should be read as a conditional future scenario. For any population comparison, the safest approach is to state the date, population concept, and statistical status alongside the number.
Select area
Create a post
Posting is free and no registration is required.